Integrating Oracle PBCS with Power BI Pro
Mike Falconer
Brovanture Consultant
Have you ever wanted to visualise your forecast using state of the art tools?
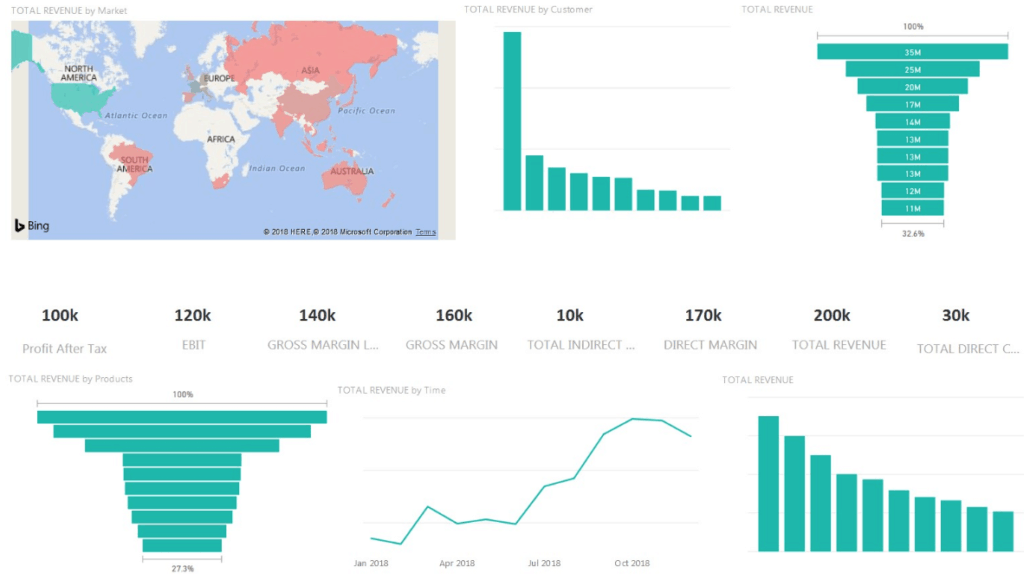
Oracle’s PBCS is a fantastic tool for processing Forecasting and Budgeting data, but despite Oracle’s best efforts, the dashboarding has always fallen short of the competition. Regardless of how great their dashboarding is, most execs want to see management information from all their systems together in a simple, user-friendly, central tool.
I’m going to walk you through the use case for integrating PBCS with Power BI, as well as the pros and cons of several different approaches. First, lets identify the main requirements:
- Data should be extracted at a sensible level for dashboarding
- Reporting attributes should be included if possible
- Regular integrations, ideally automatically performed overnight, are essential
The first step is extracting data from PBCS. If you’re on-premise, you may as well stop reading now, because you can simply use Power BI’s SQL database connector to sync up with your SQL data store in the Essbase backend and bypass any integration process. However, if you’re a cloud user it’s not quite so simple. As my colleague Gui is fond of saying: “there are many ways to skin a cloud”
Vanilla PBCS Export Data:
Pros
- Uses a wizard and works for ASO cubes
Cons
- Outclassed in every way by a DATAEXPORT command in a business rule unless ASO
- Requires significantly more ETL by the Power BI tool
DATAEXPORT command in business rule:
Pros
- Extremely configurable, see the Oracle SET DATAEXPORT OPTIONS page for all options
- Can be run using EPMAutomate and automatically downloaded from the cloud
- File can be exported in columnar format that suits loading into Power BI
Cons
- Can’t export attributes, and export file requires a dense dimension in the columns
- Heading row is exported over two rows and requires some fiddly batch scripting to process
- Can’t export aliases
FDMEE Export to Flat file:
Pros
- Can use mapping tables to simulate exporting aliase can be run using EPMAutomate and automatically downloaded from the cloud
Cons
- File is exported in Essbase format rather than columnar format
- Complex to set up and unwieldly to understand
- tables add extra maintenance
Financial Report using Export to Excel:
Pros
- Can efficiently export aliases and attributes but not attribute aliases
- Extremely configurable, with header row easily defined for more dynamic load files
Cons
- Limited size based on max cell count limit in forms
- Cannot be automatically updated using EPMAutomate or batch bursting.
Each of the options above has its place so take a read through each one and identify which set of pros and cons fit your set of requirements. Personally, I’ve preferred the financial report where attributes are required, and the DATAEXPORT command where they are not.
If you choose to use a financial report, you should save an Excel workbook on a server and use Smart View to open the financial report you’re using as the basis of your Power BI dataset. Then, open Power BI Pro and import the workbook as your data source, taking advantage of the great ETL (Extract, Transform Load) tools in Power BI Pro to transform your data.
I’ll show below how to set up a fully automated approach using the DATAEXPORT command, as it’s the most elegant solution for near-live dashboarding I’ve found. Firstly, select your subset of data that you’d like to export. You need a dense dimension to act as the columns and it must not be period. I’ve used accounts, and then specified a smaller subset of accounts to decrease the export size.
- Level – Level0 is typically the best for integrating to Power BI as you won’t have your dimension hierarchies, you’ll be wanting to split data using your other dimensions.
- OverwriteFile – Must be ON to avoid needless admin
- ColFormat – ON, this gives you a nice columnar format for loading.
- NonExistingBlocks – Up to you. If your subset is small enough, this can help ensure you get all dynamic data. If everything is stored, turn it off
- ColHeader – The dimension on the columns. I’ve used account, must be dense.
- DynamicCalc – If you want dynamic calc members included, turn this on.
- DimHeader – ON, we need this to make the export more dynamic
- Missing Character – Either blank or 0. This helps Power BI pick up the column as numeric
- Filename – Put it in /u03/lcm which will allow you to export using EPMAutomate.

When you run this business rule, you will be able to see the file in Overview -> Inbox/Outbox Explorer

Next, write yourself an EPMAutomate script to run the business rule, download the file, and process the two header rows into one header row. Or if that seems like too much work, use mine:
@echo off
set userID=xxxxxx
set password=xxxxxx
set IDOMAIN=xxxxxx
set PBCSURL=https://planning-test-%IDOMAIN%.pbcs.em2.oraclecloud.com/
set LOGURL=C:\Oracle\Logs\log.log
set REPORTNAME=”C:\Oracle\EPM Automate\bin\DataExportTest.csv”
set OUTPUTLOCATION=”C:\Oracle\PowerBISource.csv”
echo ————————————-START OF PROGRAM ————————————- >>%LOGURL%
echo —– Navigating to the EPM Automate folder —– >>%LOGURL%
cd C:\Oracle\EPM Automate\bin\ >>%LOGURL%
echo —– Logged in using encrypted user credentials —– >>%LOGURL%
call epmautomate login %userID% %password% %PBCSURL% %IDOMAIN% >>%LOGURL%
echo —– Run extract business rule —– >>%LOGURL%
call epmautomate runbusinessrule ExportTest
echo —– Download repository file —– >>%LOGURL%
call epmautomate downloadfile DataExportTest.csv >>%LOGURL%
echo —– Logout —– >>%LOGURL%
call epmautomate logout >>%LOGURL%
FOR /f “tokens=1* delims=:” %%a IN (‘findstr /n “^” %REPORTNAME%’) DO (
IF %%a leq 1 set row1=%%b
IF %%a leq 2 set row2=%%b
)
set rowx=%row1:~3,-10%,%row2%
echo %rowx% >%OUTPUTLOCATION%
FOR /f “tokens=1* delims=:” %%a IN (‘findstr /n “^” %REPORTNAME%’) DO (
IF %%a geq 3 echo %%b>>%OUTPUTLOCATION%
)
The above will process the downloaded file and change the header row as shown below:

Next, simply load up your Power BI Desktop app and select the data file you’ve created as your source data. You can now perform as much ETL as you’d like to the file, and that will be repeated on all future queries on that file. I highly recommend performing the following steps:
Merge Period and Year columns, with a space between them.
Change the data type of the column to Date and Power BI will turn it into one Time dimension.
So, to recap, at this point we have:
- A business rule to export any data that we want from PBCS
- A script that automatically runs the business rule, downloads the output and processes it into a Power BI format
- A Power BI query which can be used to build dashboards
All that’s required is to schedule your EPMAutomate script to run on your server as regularly as you want, and to set up Power BI refreshes at a similar timeframe. To do this, you will need to publish your dataset to the Power BI online web application. Afterwards, select the dataset and set up scheduled refreshes. You will need to download gateway software onto your server and log in to it using an account with a Power BI Pro licence to set it up. Microsoft walk you through it very simply in the Power BI dashboard.

Now you have near-live dashboarding from your forecasting and budgeting system, allowing you to analyse your data at any level you choose, and produce some fantastic dashboards!


 +44 (0)1483 685450
 contact us